Have you ever wanted to filter a visual by selecting a range of values for a measure? You may have found that you cannot populate a slicer with a measure. But you can do this another way.
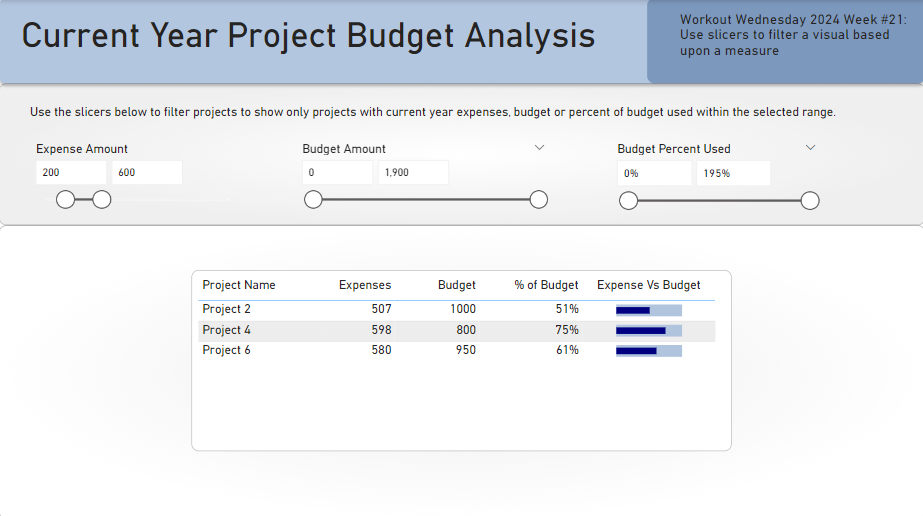
I have a report that shows project expenses and budgets. I want users to be able to filter the list of project to only those which have expenses within my selected range. I also have 2 other slicers for project budget and percent of budget used, but let’s just focus on the expense amount slicer.

To achieve this, I first need to create a table that contains a column with values I can use to populate the slicer. You can do this by creating a numeric range parameter, creating a calculated table in DAX, or by creating a table in Power Query. I chose the Power Query route. Here is the M code I used to create a table that has values from 0 to 1900 incrementing by 1.
let
Source = List.Generate(() => 0, each _ < 2000, each _ + 1),
#"Converted to Table" = Table.FromList(Source, Splitter.SplitByNothing(), null, null, ExtraValues.Error),
#"Renamed Columns" = Table.RenameColumns(#"Converted to Table",{{"Column1", "Amount"}})
in
#"Renamed Columns"
I put the Amount column created in this new table in the Fields list for my slicer and make sure the style is set to “Between”.
I make the table visual as normal, so it shows all projects to start. Then I create a new measure.
Selected Projects - Expenses =
var _expensemin = COALESCE(Min('Range - Expense'[Amount]), CALCULATE(Min('Range - Expense'[Amount]), ALL('Range - Expense')))

var _expensemax = COALESCE(max('Range - Expense'[Amount]), CALCULATE(max('Range - Expense'[Amount]), ALL('Range - Expense')))

var _result = CALCULATE(COUNTROWS('Dim Project'), Filter('Dim Project', [Expenses] >= _expensemin && [Expenses] <= _expensemax))

return _result
This measure gets the min and max expense amounts selected in the slicer, and then filters the projects to those with expenses (based upon a measure called [Expenses]) within the selected range.
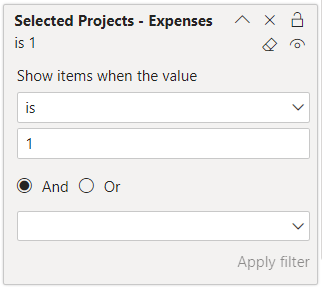
Next I add the [Selected Projects – Expenses] measure to the table visual filters, and set the filter value to 1.
Now, when I set my Expense Amount slicer to the range of 200 to 600, we can see that only 3 projects are shown out of the total 6.

As you can see in my report, I have three slicers used to filter measures. I added another measure that checks all three ranges and if the project matches all three ranges, it returns a 1; otherwise it returns blank. I used a similar visual-level filter with this measure.

