Recently I needed to view the logs from an Azure Site to Site VPN to see why it wasn’t working as expected. When Azure Site to Site VPNs aren’t working as expected the GUI falls apart quickly for troubleshooting.
Log Analytics is where this problem gets solved. Log Analytics is going to allow you to see basically everything that the Azure Network Gateway is doing. Setting the feed up to Log Analytics isn’t as straightforward as it could be, but it is documented in this post.

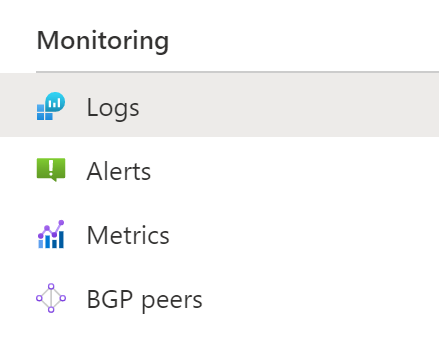
In order to view the data, open the Azure Network Gateway in the Azure Portal and find the “Logs” option under “Monitoring” on the menu on the left. This will open the Log Analytics query editor. Cancel out of the sample queries that it gives you access to.
The following query will show you the messages that you are receiving from the IKE Diagnostics.
AzureDiagnostics
| where TimeGenerated > ago(24h)
| where Category == “IKEDiagnosticLog”
| project TimeGenerated, Resource, Message
| order by TimeGenerated desc
The following query will show you the messages that are being logged by the site-to-site VPN Tunnel itself.
AzureDiagnostics
| where TimeGenerated > ago(24h)
| where Category == “TunnelDiagnosticLog”
| project TimeGenerated, Resource, stateChangeReason_s
| order by TimeGenerated desc
With the information provided from these queries you should be able to troubleshoot just about any VPN issue that you are seeing when setting up the Azure Site to Site VPN.
Denny
