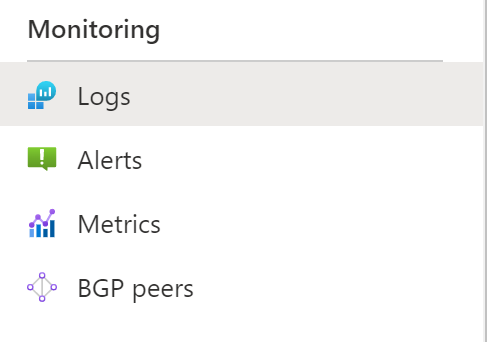
If you’ve ever set up an Azure Network Gateway for Site to Site or Person to Site VPNing you’ve probably wanted to be able to see logging from the gateway. In the Azure portal, you can see a Logs option, but all it does is tell you to set up log analytics and the link that it gives you is … less than helpful.

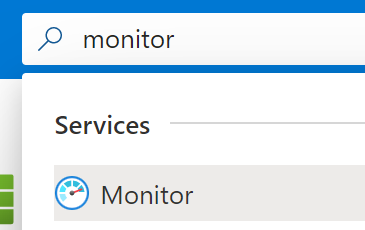
In order to set up Log Analytics for your Azure Network Gateway (or other Azure resources that don’t have a direct way to configure diagnostics), you need to configure the Azure Monitor. To find the Azure Monitor search for “monitor” in the search bar within the Azure Portal. Once you find Monitor click on the Monitor option.

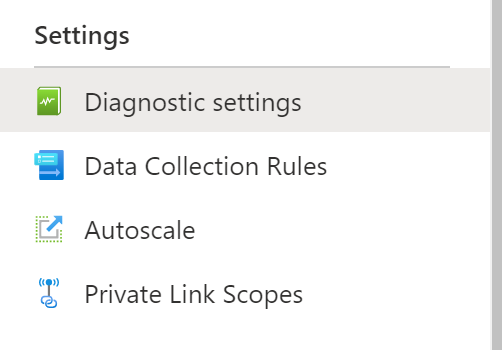
From here scroll down on the menu and find the settings section. In this section, you’ll find a “Diagnostic Settings” option. Select “Diagnostic Settings”.
This will bring up a screen that includes a subscription selector, a resource group selector, and a resource type selector. Select the subscription that contains the resource, and the page will refresh with the resources in that subscription. If needed filter down the list based on the resource group and resource type. Once you have found the resource you wish to add to Log Analytics, select the resource and another page will open.

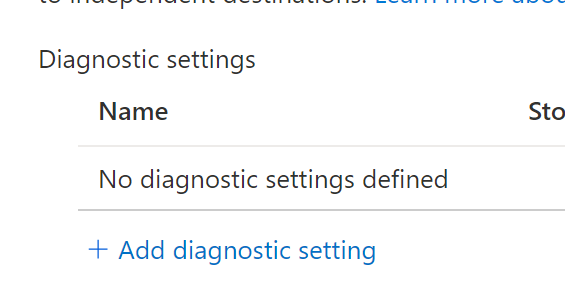
On the new page, you’ll see that there are no diagnostic settings defined. Click on the “Add diagnostic settings” link and a new page will open. This new page will allow you to select the Log Analytics workspace that you will send the data to as well as the kind of data that you want to be logged in addition to a same for the settings.
Set the name, the kind of data that you want to send to Log Analytics, and the Log Analytics workspace that you want to send the data to.
Click OK to save the settings, and if needed close the window (it doesn’t always close in my experience). At this point (or in a few minutes) the Logs option on the resource should work correctly and allow you to view the data in Log Analytics related to the resource.
Denny

