As I mentioned in my post a couple of weeks ago, monitoring the plan cache on a readable secondary replica can be a challenge. My customer was seeing dramatically different performance, depending on whether a node was primary or secondary. As amazing as the Query Store in SQL Server 2016 is, it does not allow you to view statistics from the readable secondary. So that leaves you writing xQuery to mine the plan cache DMVs for the query information you are trying to identify.
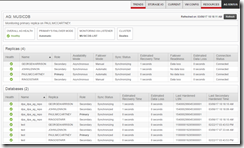
My friends at Solarwinds (Lawyers: see disclaimer at bottom of post) introduced version 11.0 of Database Performance Analyzer (DPA, a product you may remember as Ignite) which has full support for Availability Group monitoring. As you can see in the screenshot below, DPA gives a nice overview of the status of your AG, and also lets you dig into the performance on each node.
There are a host of other features in their new releases, which you can check out some of their new hybrid features in their flagship product Orion. Amongst these features, a couple jumped out at me—there is now support for Amazon RDS and Azure SQL Database in DPA, and there is some really cool correlation data that will let your compare performance across your infrastructure. So, when you the DBA is arguing with the SAN, network, and VM teams about where the root cause of the performance problem, this tool can quickly isolate the root cause of the issue. With less fighting. These are great products, give them a look.
Disclaimer: I was not paid for this post, but I do paid work for SolarWinds on a regular basis.


